

Key information
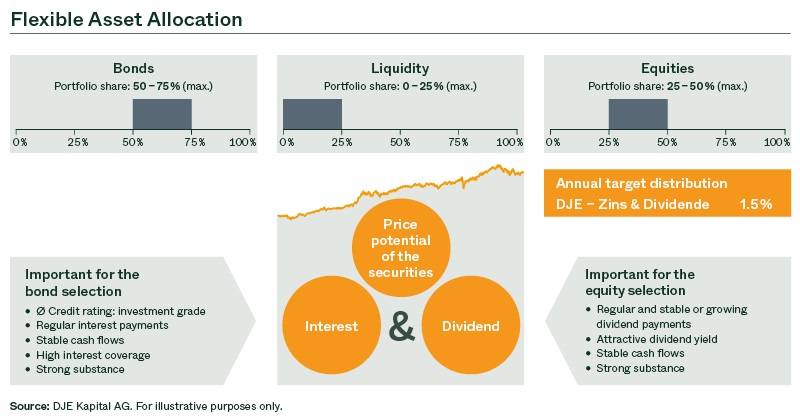
DJE - Zins & Dividende is a multi-asset fund managed independently from any benchmark. The fund aims for absolute returns with the help of conservative drawdown management. On the equity side, the fund invests primarily in equities with above-average dividend yields. The investment objective is to invest across asset classes and generate regular income from fixed income instruments, supplemented by capital gains and dividends on the equity side. The selection criteria for companies are recurring dividend payments as well as investor-friendly corporate policies such as stock buybacks. While the focus is on dividend paying stocks, the fund may also invest in companies that do not currently pay a dividend. The fund's flexible investment approach allows it to adapt quickly to changing market conditions. To reduce volatility, at least 50% of the fund is invested in bonds. Equity exposure fluctuates between 25% and 50%. Currency risks can be hedged opportunistically.
Responsible manager since inception
Responsible manager since 01/07/2019 as co-manager
Key information
| ISIN: | LU0553164731 |
| WKN: | A1C7Y8 |
| Category: | Fund EUR Moderate Allocation - Global |
| Minimum Equity: | 25% |
| Partial Exemption of Income ¹: | 15% |
| VG/KVG: | DJE Investment S.A. |
| Fund Manager: | DJE Kapital AG |
| Risk Category: | 3 |
| This sub-fund/fund promotes ESG features in accordance with Article 8 of the Disclosure Regulation (EU Nr. 2019/2088). | |
| Type of Share: | distribution |
| Financial Year: | 01.01. - 31.12. |
| Launch Date: | 10/02/2011 |
| Fund currency: | EUR |
| Fund Size (01/07/2024): | 3.888,37 Mio EUR |
| TER p.a. (29/12/2023): | 1,69% |
| Reference Index: | - |
Fees
| Initial Charge: | 4,000% |
| Management Fee p.a.: | 1,500% |
| Custodian Fee p.a.: | 0,060% |
|
Performance Fee p.a.: 10% of the [Hurdle: exceeding 4% p.a.] unit value performance, provided the unit value at the end of the settlement period is higher than the highest unit value at the end of the previous settlement periods of the last 5 years [High Water Mark Principle]. The settlement period begins on 1 January and ends on 31 December of a calendar year. Payment is made at the end of the accounting period. For further details, see the sales prospectus. |
Ratings & Awards (01/07/2024)
| Morningstar*: |
|
|
Awards: Austrian Fund Award 2024 "Outstanding" in the category "Mixed Funds Global Balanced" Best Asset Manager 2023 Place 4 out of 381 funds in the category "Balanced" in the ranking of Wirtschaftswoche and MMD Mountain View Fund Awards 2023 Winner in the category "Mixed Funds Global Balanced" |
All ESG information presented here relates to the fund portfolio shown and is sourced from MSCI ESG Research, a leading provider of environmental, social and governance analysis and ratings.
| MSCI ESG RATING (AAA-CCC): | A |
| ESG-Qualityrating (0-10): | 6,881 |
| Environment Rating (0-10): | 6,450 |
| Social Rating (0-10): | 5,087 |
| Governance-Rating(0-10): | 5,793 |
| ESG rating in comparison group (0% lowest, 100% highest value): | 19,350% |
| Peergroup: |
Mixed Asset EUR Bal - Global
(806 Fonds) |
| Coverage rate ESG rating: | 88,617% |
| Weighted average CO₂ intensity (tons of CO₂ per 1 million US dollars in sales): | 163,709 |
Portfolio allocation according to ESG rating of individual securities
Report date: 28/06/2024
- The fiscal treatment depends on the personal circumstances of the respective client and can be subject of change in the future.
- is proprietary to Morningstar and/or ist content providers may not be copied or distributed and is not warranted ob e accurate, complete or timely. Neither Morningstar nor ist content providers are responsible for any damages or losses arising from any use of this information. Past performance is no guarantee of future results.
Perfomance Chart
Performance in Percent
Rolling performance in %
Risk metrics (01/07/2024) |
|
|---|---|
| Standard Deviation (2 years): | 5,63% |
| Tracking Error (1 years): | - |
| Value at Risk (99% / 20 days): | -3,43% |
| Maximum Drawdown (1 year): | -3,06% |
| Sharpe Ratio (2 years): | 0,45 |
| Correlation (1 years): | - |
| Beta (1 years): | - |
| Treynor Ratio (1 years): | - |
Country allocation total portfolio (% NAV)
*Note: Cash position is included here because it is not assigned to any country or currency.
Data: Anevis Solutions GmbH, own illustration 28/06/2024
Top Ten Holdings in % of Fund Volume
| Equity Portfolio | Bond portfolio | ||
|---|---|---|---|
| APPLE INC | 1.87% | MCDONALD'S CORP (2.625%) | 2.45% |
| TAIWAN SEMICONDUCTOR MANUFAC | 1.73% | US TREASURY (3.50%) | 1.95% |
| ALPHABET INC-CL C | 1.53% | NORWEGIAN GOVERNMENT (1.75%) | 1.67% |
| META PLATFORMS INC-CLASS A | 1.53% | ANGLO AMERICAN CAPITAL (2.625%) | 1.63% |
| ELI LILLY & CO | 1.48% | NESTLE HOLDINGS INC (4.00%) | 1.42% |
| JPMORGAN CHASE & CO | 1.41% | NIKE INC (2.40%) | 1.37% |
| VISA INC-CLASS A SHARES | 1.35% | FRAPORT AG (1.8750%) | 1.37% |
| LINDE PLC | 1.31% | META PLATFORMS INC (3.85%) | 1.26% |
| INDITEX | 1.28% | DEUTSCHE LUFTHANSA AG (3.00%) | 1.25% |
| HANNOVER RUECKVERSICHERU-REG | 1.26% | US TREASURY (2.625%) | 1.21% |
Current status: 28/06/2024
When buying a fund, one acquires shares in the said fund, which invests in securities such as shares and/or in bonds, but not the securities themselves.
Top Country Allocation in % of Fund Volume (28/06/2024) |
|
|---|---|
| United States | 43,98% |
| Germany | 14,69% |
| United Kingdom | 4,37% |
| Japan | 4,29% |
| France | 3,57% |
Asset allocation in % of the fund volume (28/06/2024) |
|
|---|---|
| Bonds | 50,77% |
| Stocks | 48,50% |
| Cash | 0,73% |
Investment strategy
The objective of DJE - Zins & Dividende is to generate a steady return – even in volatile markets. On the fixed income side, the fund invests primarily in debt instruments from sovereign issuers and corporates with investment-grade ratings. On the equity side, the fund relies on the established DJE dividend strategy. We believe that dividends can make a strong contribution to performance over time due to the compound interest effect. Time-series analysis shows that only around half of the equity returns are due to capital gains. The other half is attributable to dividends. The fund aims for an above-average dividend yield relative to the broader market. However, the fund may also include stocks that do not currently pay a dividend. The asset allocation is flexible and is adjusted depending on market environment. To reduce volatility, at least 50% of the fund are invested in bonds. Equity exposure fluctuates between 25% and 50%. Currency risks can be hedged opportunistically.
Chances
- Possible share price gains are complemented by interest income from international bonds and dividend distributions.
- Regular returns from interest and dividends can serve as a buffer in the event of stock market slumps.
- The balanced fund aims for a steady positive performance with low volatility in all market environments.
- The portfolio is continuously adjusted to the changing market environments.
Risks
- Share prices can fluctuate relatively strongly due to market, currency and individual value factors.
- The income from interest and dividends is not guaranteed.
- Bonds are subject to price risks if interest rates rise, as well as country risks and the creditworthiness and liquidity risks of their issuers.
- There is a currency risk for euro investors in securities not denominated in euros.
- The value of an investment may rise or fall and investors may not get back the amount invested.
Target group
Der Fonds eignet sich für Anleger
- who wish to take advantage of opportunities in both the equity and bond segments
- with a medium to long-term investment horizon
- who seek flexibility in portfolio design
Der Fonds eignet sich nicht für Anleger
- with a short-term investment horizon
- who are not prepared to accept increased volatility
- who seek safe returns
Monthly Commentary
The stock markets in Europe and North America performed well in May and were able to largely offset the losses from the previous month. The main driver behind this positive development was once again market expectations that the doves could prevail over the hawks in monetary policy. Weaker labour market data eased concerns that the US economy could overheat. In addition, US inflation fell from 3.5% to 3.4% in April, while core inflation (excluding energy and food) fell from 3.8% to 3.6% - both year-on-year. This rekindled hopes of interest rate cuts by the Fed before the end of the year, especially as the markets have firmly priced in a key interest rate cut by the European Central Bank in June. However, the rally on the stock markets began to stutter around the middle of the month. This was due, among other things, to a rise in inflation in the eurozone from 2.4% to 2.6% and a jump in the Purchasing Managers' Index for the manufacturing sector in the eurozone from 45.7 to 47.3 points. As a result, the markets revised their interest rate expectations. The bond markets reacted very differently to this. In Europe, yields on high-quality government bonds rose slightly. At 2.66%, 10-year German government bonds yielded 8 basis points higher than in the previous month. In contrast, the yield on their US counterparts fell by 18 basis points to 4.50%. Against this market backdrop, the DJE - Zins & Dividende rose by 0.52%. The vast majority of sectors on the global equity market performed positively. The strongest results came from the technology, utilities and insurance sectors. By contrast, the automotive, travel & leisure and energy sectors ended the month of May in negative territory. The fund benefited from its stock selection in the technology, financial services and industrials sectors. The technology sector benefited from the fact that various companies exceeded analysts' expectations. By contrast, the automotive, basic materials and utilities sectors, among others, performed disappointingly. The automotive sector is currently being weighed down by tough competition from Chinese e-cars on the one hand and the discussion surrounding the possible introduction of tariffs on Chinese e-car imports on the other, which China would probably respond to with tariffs of its own. Strong individual stock results came from graphics processor manufacturer Nvidia and technology group Apple (both USA) and Japanese Recruit Holding, which is active in the media, advertising, IT and temporary employment sectors, among others. By contrast, the US software providers Salesforce and Intuit and the German-American industrial gases group Linde, among others, performed disappointingly. The fund management adjusted the allocation only moderately over the course of the month and increased the weighting of the technology sector in particular, which is again driven by AI stocks, healthcare and industry. The insurance, financial institutions and consumer goods & services sectors, among others, were reduced slightly. The equity allocation fell from 48.82% to 47.46% as a result of the adjustments. On the bond side, the fund benefited in particular from high-yield European corporate bonds, whose yields fell. On the other hand, the performance of US bonds was negatively impacted by the weaker US dollar. The fund's bond ratio remained virtually unchanged at 50.08% (previous month: 50.29%). At the end of the month, securities denominated in US dollars were partially hedged against the euro. The partial hedging of the Hong Kong dollar against the US dollar was also maintained.