

Key information
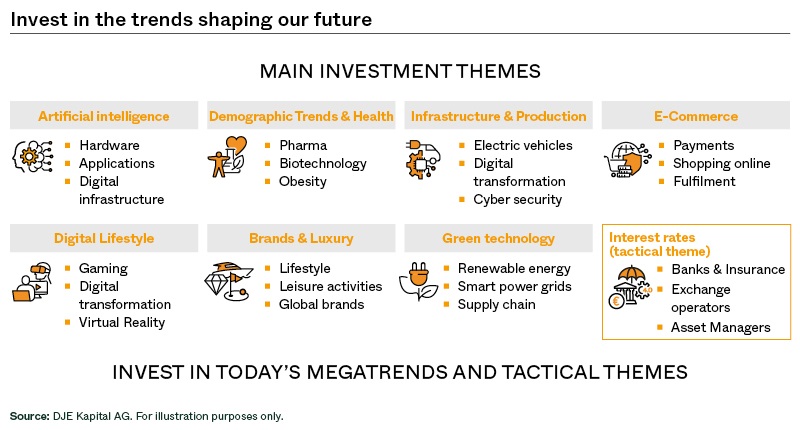
DJE - Multi Asset & Trends is a dynamic global multi-asset fund. The diversified portfolio of approximately 50 to 70 equities and between 20 to 40 bonds is managed independent from any benchmark. The fund management pursues a thematic approach to benefit from current and long-term trends, including digital transformation, demographics & health, and clean technologies. The strategy targets companies with stable business models and above-average growth prospects, combined with reasonable valuations. Additional diversification is achieved by investing in up to 10% of the portfolio in gold. The fund seeks to exploit global opportunities to generate an attractive performance.
Responsible manager since 23/01/2017
Key information
| ISIN: | LU0159549145 |
| WKN: | 164317 |
| Category: | Fund EUR Flexible Allocation - Global |
| Minimum Equity: | 51% |
| Partial Exemption of Income ¹: | 30% |
| VG/KVG: | DJE Investment S.A. |
| Fund Manager: | DJE Kapital AG |
| Risk Category: | 4 |
| This sub-fund/fund promotes ESG features in accordance with Article 8 of the Disclosure Regulation (EU Nr. 2019/2088). | |
| Type of Share: | distribution |
| Financial Year: | 01.01. - 31.12. |
| Launch Date: | 27/01/2003 |
| Fund currency: | EUR |
| Fund Size (01/07/2024): | 298,72 Mio EUR |
| TER p.a. (29/12/2023): | 1,86% |
| Reference Index: | - |
Fees
| Initial Charge: | 4,000% |
| Management Fee p.a.: | 1,600% |
| Custodian Fee p.a.: | 0,060% |
|
Performance Fee p.a.: 10% of the unit value development, provided the unit value at the end of the settlement period is higher than the highest unit value at the end of the previous settlement periods of the last 5 years [High Water Mark Principle]. The settlement period begins on 1 January and ends on 31 December of a calendar year. Payment is made at the end of the accounting period. For further details, see the sales prospectus. |
Ratings & Awards (01/07/2024)
| Morningstar*: |
|
|
Awards: Scope Award 2023 Best Fund in the category "Mixed Fund Global Flexible" in Switzerland |
All ESG information presented here relates to the fund portfolio shown and is sourced from MSCI ESG Research, a leading provider of environmental, social and governance analysis and ratings.
| MSCI ESG RATING (AAA-CCC): | A |
| ESG-Qualityrating (0-10): | 6,953 |
| Environment Rating (0-10): | 6,196 |
| Social Rating (0-10): | 5,306 |
| Governance-Rating(0-10): | 5,774 |
| ESG rating in comparison group (0% lowest, 100% highest value): | 27,170% |
| Peergroup: |
Mixed Asset EUR Agg - Global
(449 Fonds) |
| Coverage rate ESG rating: | 88,052% |
| Weighted average CO₂ intensity (tons of CO₂ per 1 million US dollars in sales): | 111,801 |
Portfolio allocation according to ESG rating of individual securities
Report date: 28/06/2024
- The fiscal treatment depends on the personal circumstances of the respective client and can be subject of change in the future.
- is proprietary to Morningstar and/or ist content providers may not be copied or distributed and is not warranted ob e accurate, complete or timely. Neither Morningstar nor ist content providers are responsible for any damages or losses arising from any use of this information. Past performance is no guarantee of future results.
Perfomance Chart
Performance in Percent
Rolling performance in %
Risk metrics (01/07/2024) |
|
|---|---|
| Standard Deviation (2 years): | 8,32% |
| Tracking Error (1 years): | - |
| Value at Risk (99% / 20 days): | -5,09% |
| Maximum Drawdown (1 year): | -4,20% |
| Sharpe Ratio (2 years): | 0,53 |
| Correlation (1 years): | - |
| Beta (1 years): | - |
| Treynor Ratio (1 years): | - |
Country allocation total portfolio (% NAV)
*Note: Cash position is included here because it is not assigned to any country or currency.
Data: Anevis Solutions GmbH, own illustration 28/06/2024
Top Ten Holdings in % of Fund Volume
| Equity Portfolio | Portfolio without share | ||
|---|---|---|---|
| ALPHABET INC-CL C | 3.02% | INVESCO PHYSICAL GOLD ETC | 6.70% |
| APPLE INC | 2.41% | UNITED MEXICAN STATES (4.875%) | 2.32% |
| MICROSOFT CORP | 2.22% | BUONI POLIENNALI DEL TES (4.20%) | 1.68% |
| ALLIANZ SE-REG | 2.11% | NORWEGIAN GOVERNMENT (1.75%) ( | 1.32% |
| AMAZON.COM INC | 2.10% | US TREASURY (4.875%) | 1.25% |
| HANNOVER RUECKVERSICHERU-REG | 1.58% | US TREASURY N/B | 0.91% |
| TOKIO MARINE HOLDINGS INC | 1.48% | MSCI INC (4.00%) | 0.85% |
| NOVO NORDISK A/S-B | 1.45% | US TREASURY (3.50%) | 0.83% |
| SUMITOMO MITSUI FINANCIAL GR | 1.42% | SOFTBANK GROUP CORP (2.8750%) | 0.80% |
| BROADCOM LTD | 1.34% |
Current status: 28/06/2024
When buying a fund, one acquires shares in the said fund, which invests in securities such as shares and/or in bonds, but not the securities themselves.
Top Country Allocation in % of Fund Volume (28/06/2024) |
|
|---|---|
| United States | 42,25% |
| Germany | 12,61% |
| Japan | 9,36% |
| United Kingdom | 4,66% |
| France | 4,42% |
Asset allocation in % of the fund volume (28/06/2024) |
|
|---|---|
| Stocks | 69,01% |
| Bonds | 22,39% |
| Certificates | 7,39% |
| Cash | 1,21% |
Investment strategy
The asset allocation of the DJE - Multi Asset & Trends fund follows a consistent bottom-up approach. It is based on fundamental factors such as market positioning, balance sheet and earnings potential, valuation, management quality, and sustainability criteria. The fund management takes a flexible approach to asset classes and allocates across sectors and countries with the aim of managing risk and capitalising on opportunities that arise. Gold is an asset class that has a low correlation with equities and bonds and provides additional stability; it can represent up to 10% of the fund. With the growth-oriented risk-reward profile and broad diversification across different asset classes, the fund aims for attractive returns combined with low volatility.
Chances
- The cash quota (up to 49%) can be used flexibly in order to cushion difficult market phases as much as possible.
- Equities enable participation in the growth opportunities of the global equity markets independently of benchmark index specifications.
- Flexible addition of bonds (up to 50%) and other securities such as certificates on precious metals (up to 10% gold) possible.
- Offensive, theme-oriented, global multi-asset fund with ongoing adjustment of its portfolio to the expected market situation.
Risks
- Bonds are subject to price risks when interest rates rise, as well as country risks and the creditworthiness and liquidity risks of their issuers.
- In the case of securities not denominated in euros, there is a currency risk for euro investors.
- An investment in precious metals is subject to fluctuations in value.
- Share prices can fluctuate relatively strongly due to market, currency and individual value factors.
Target group
Der Fonds eignet sich für Anleger
- who wish to reduce risk through broad diversification of investments
- with a medium to long-term investment horizon
- who wish to reduce risk compared to a direct investment
Der Fonds eignet sich nicht für Anleger
- who seek safe returns
- with a short-term investment horizon
- who are not prepared to accept increased volatility
Monthly Commentary
The stock markets in Europe and North America performed well in May and were largely able to equalise the losses from the previous month. The German share index DAX rose by 3.16% and the broad European share index Stoxx Europe 600 gained 2.63%. The broad US index S&P 500 rose by 3.18%. The Hong Kong Hang Seng Index achieved a weaker but still positive result with a gain of 0.21%. Global equities, as measured by the MSCI World, advanced by 2.62% - all index figures in euro terms. The main driver behind this positive development was once again market expectations that the doves could prevail over the hawks in monetary policy. Weaker labour market data eased concerns that the US economy could overheat. In addition, US inflation fell from 3.5% to 3.4% in April, while core inflation (excluding energy and food) fell from 3.8% to 3.6% - both year-on-year. This rekindled hopes of interest rate cuts by the Fed before the end of the year, especially as the markets have firmly priced in a key interest rate cut by the European Central Bank in June. However, the rally on the stock markets began to stutter around the middle of the month. This was due, among other things, to a rise in inflation in the eurozone from 2.4% to 2.6% and a jump in the Purchasing Managers' Index for the manufacturing sector in the eurozone from 45.7 to 47.3 points. The markets then revised their interest rate expectations. The bond markets reacted very differently to this. In Europe, yields on high-quality government bonds rose slightly. At 2.66%, 10-year German government bonds yielded 8 basis points higher than in the previous month. In contrast, the yield on their US counterparts fell by 18 basis points to 4.50%. The price of gold rose by 1.78% to USD 2,326.99 per troy ounce in May. Shortly before the middle of the month, when hopes of interest rate cuts in the USA were high, a troy ounce briefly cost USD 2,425. In this market environment, the DJE - Multi Asset & Trends rose by 0.69%. The vast majority of sectors on the global equity market performed positively. The strongest results came from the technology, utilities and insurance sectors. By contrast, the automotive, travel & leisure and energy sectors ended the month of May in negative territory. In turn, the fund benefited from its stock selection in the construction & materials, retail and personal care, drugstore & food retailing sectors. In contrast, the automotive, basic materials and telecommunications sectors, among others, had a negative impact on the fund's performance. The strongest individual stock results were delivered by the Japanese department stores' holding company Isetan Mitsukoshi, the US graphics processor developer Nvidia and the US technology group Apple. On the other hand, the Japanese furniture holding company Nitori, the US software company Salesforce and Bank Rakyat Indonesia were among the detractors. Over the course of the month, the fund management adjusted the allocation slightly and increased the weighting of the technology, insurance and financial institutions sectors, among others. In contrast, it reduced the chemical, industrial and healthcare sectors, among others. As a result, the equity allocation rose moderately from 66.81% to 67.39%. The bond ratio remained unchanged from the previous month at 23.57%. The precious metals ratio fell from 7.84% to 7.59% and liquidity from 1.78% to 1.44%.